
In This Article
Modify Hierarchy and Structure
Overview
Once a Value Driver Tree has been created and populated with KPI data, you may need to refine its structure, update calculations, or adjust how drivers are organised. This article explains how to edit a Value Driver Tree, modify nodes, and restructure hierarchy and logic.
Editing a Value Driver Tree allows you to adapt the model as requirements change, without rebuilding it from scratch.
Enable Edit Mode
All structural changes to a Value Driver Tree are performed in Edit Mode.
To enable Edit Mode: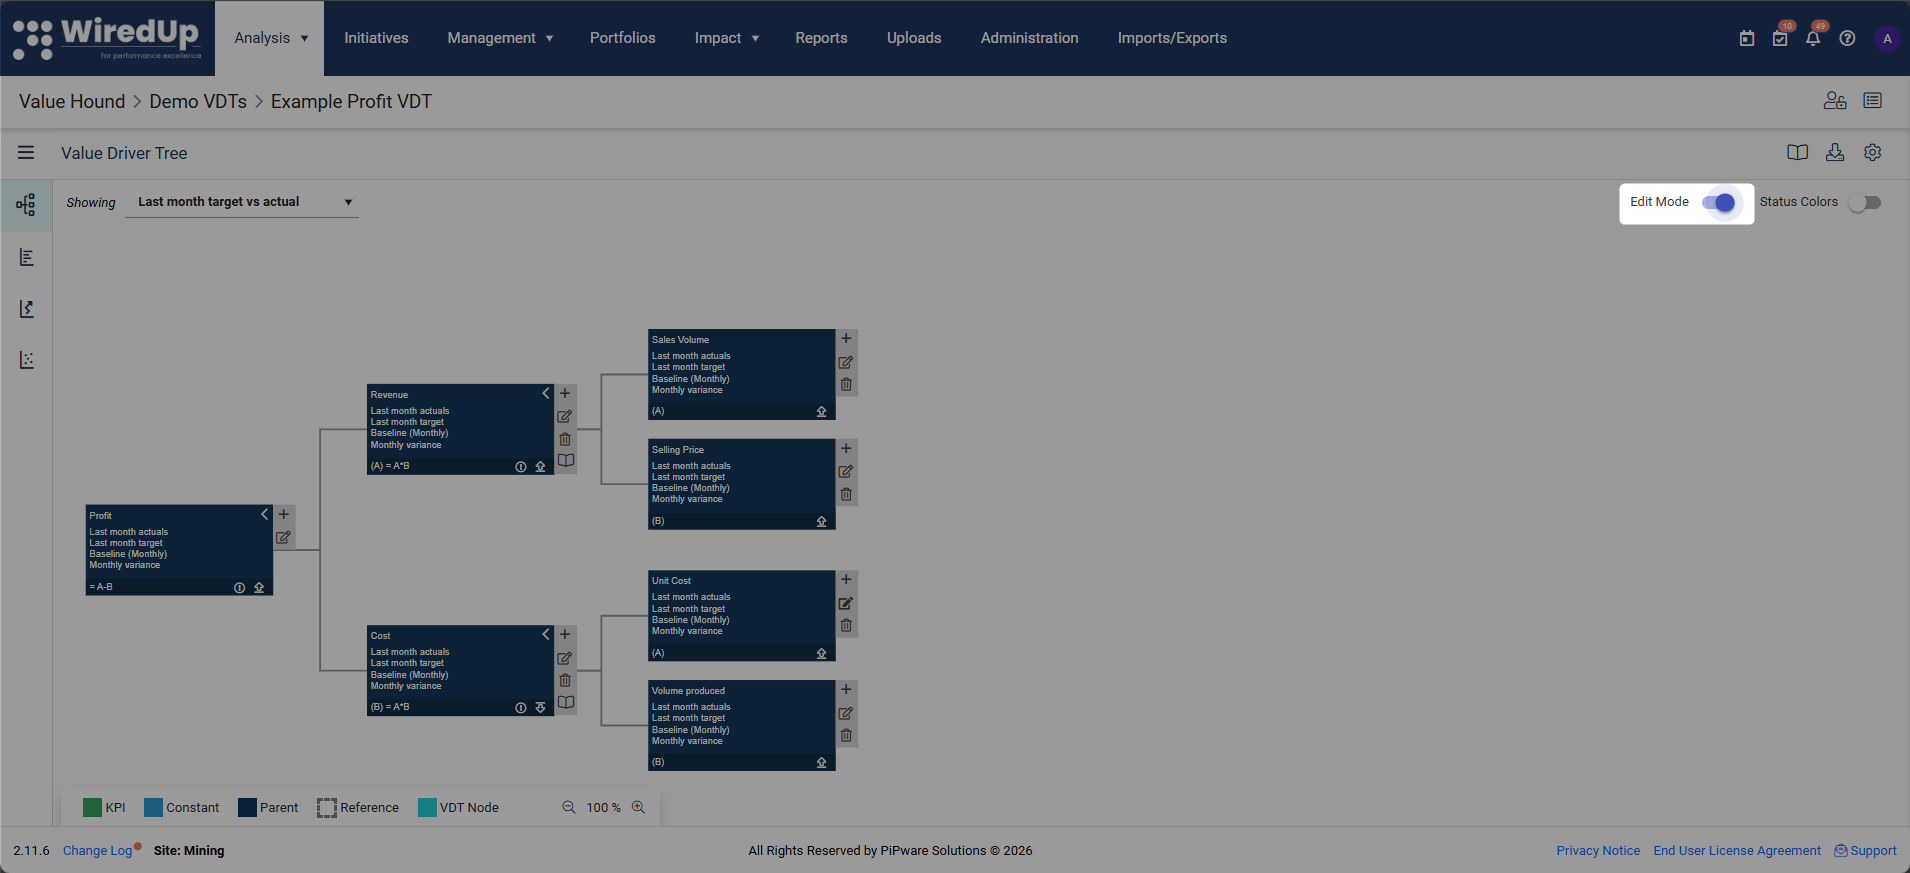
- Open the Value Driver Tree
- Select the edit slider in the toolbar
When Edit Mode is enabled, you can add, edit, move, and remove nodes within the tree.
Modify Existing Nodes
You can edit any node in the Value Driver Tree to update its configuration.
To edit a node:
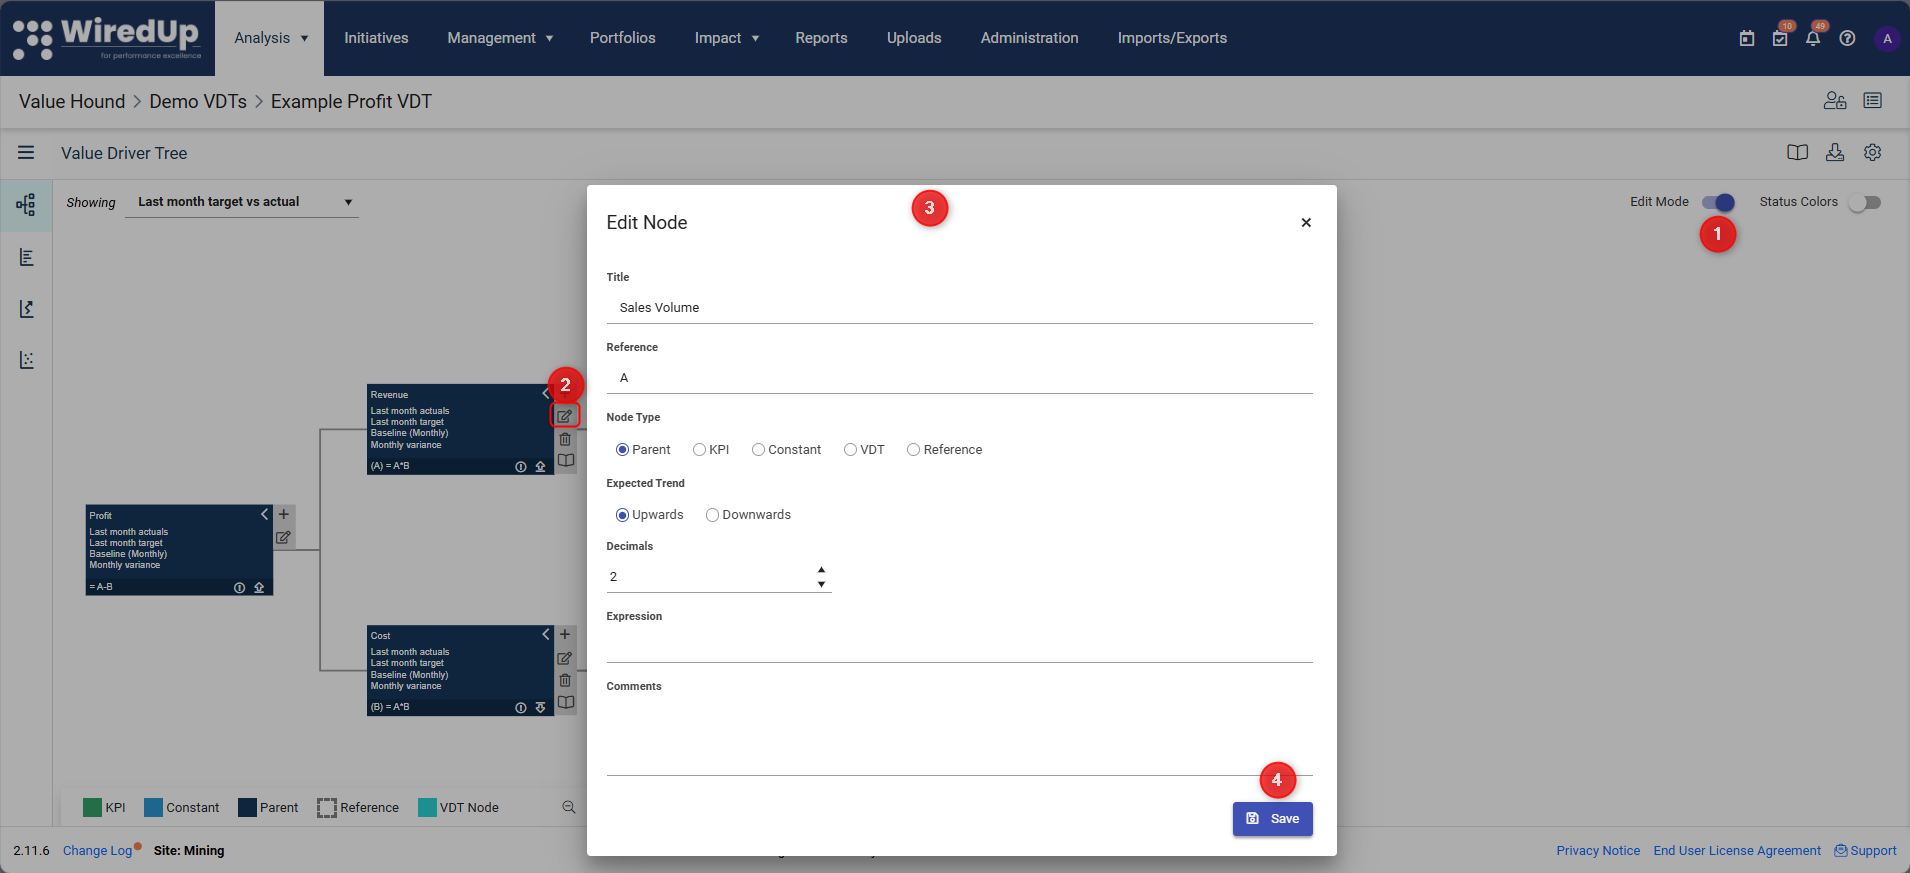
- Ensure Edit Mode is enabled
- Select the edit (pencil) icon on the node
- Update the required fields, such as:
- Node name
- Expected trend
- Decimal display
- Calculation expression (for parent nodes)
- Comments or notes
- Save the changes
You can drag and drop a node to connect to a different parent node.
Viewing Node Performance Charts
For certain node types, you can view a performance chart that visualizes field values over time based on the currently selected View.
To view a node's performance chart:
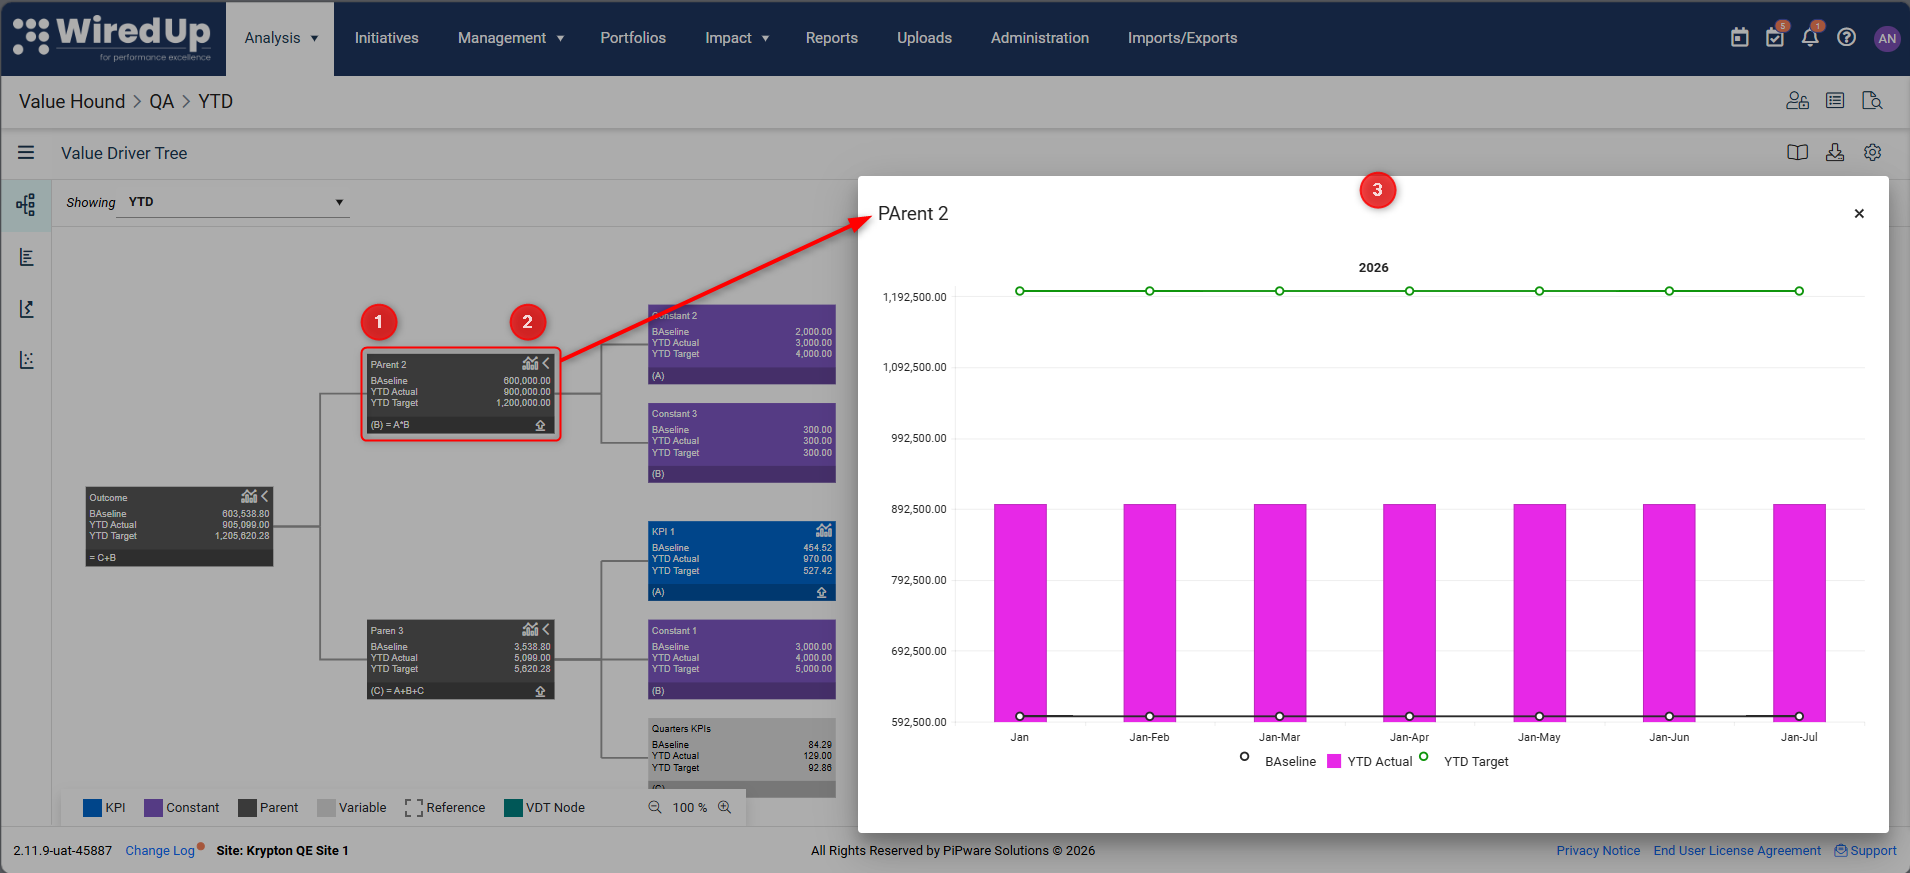
- Ensure the node is a Parent, Outcome, Reference, or Link VDT node (KPI nodes have their own charts)
- Click the chart icon in the node header
- The performance chart modal pop-up will be opened
Note: The chart icon is only visible when the currently selected View contains fields with compatible periods (monthly, weekly, quarterly, YTD, or yearly). The icon is hidden if the View contains Yesterday, Calculated, Custom, or Manual periods, or a mix of periods that map to different scales.Understanding the Performance Chart:
The chart displays:
- Bars representing Actual-type field values
- Lines representing Baseline and Target-type field values
- Legend showing each field by its configured name and color
- Hover tooltips displaying field name and value for each period
The chart scale adapts to the period configured in your View:
- Monthly periods (Last Month, This Month): Shows 12 months back from current date
- YTD: Shows months from start of current year to today
- Last Year: Shows 12 months of last year
- Weekly periods (Last Week, This Week): Shows 12-13 weeks with < Previous and Next > navigation controls
- Quarterly periods (Last Quarter, This Quarter): Shows quarterly bars
The chart uses only the fields configured in the currently selected View, ensuring it always reflects what the node is displaying.
Any changes to a node take effect immediately and may impact calculations higher up the tree.Add New Nodes
You can extend the Value Driver Tree by adding new nodes at any point.
To add a node: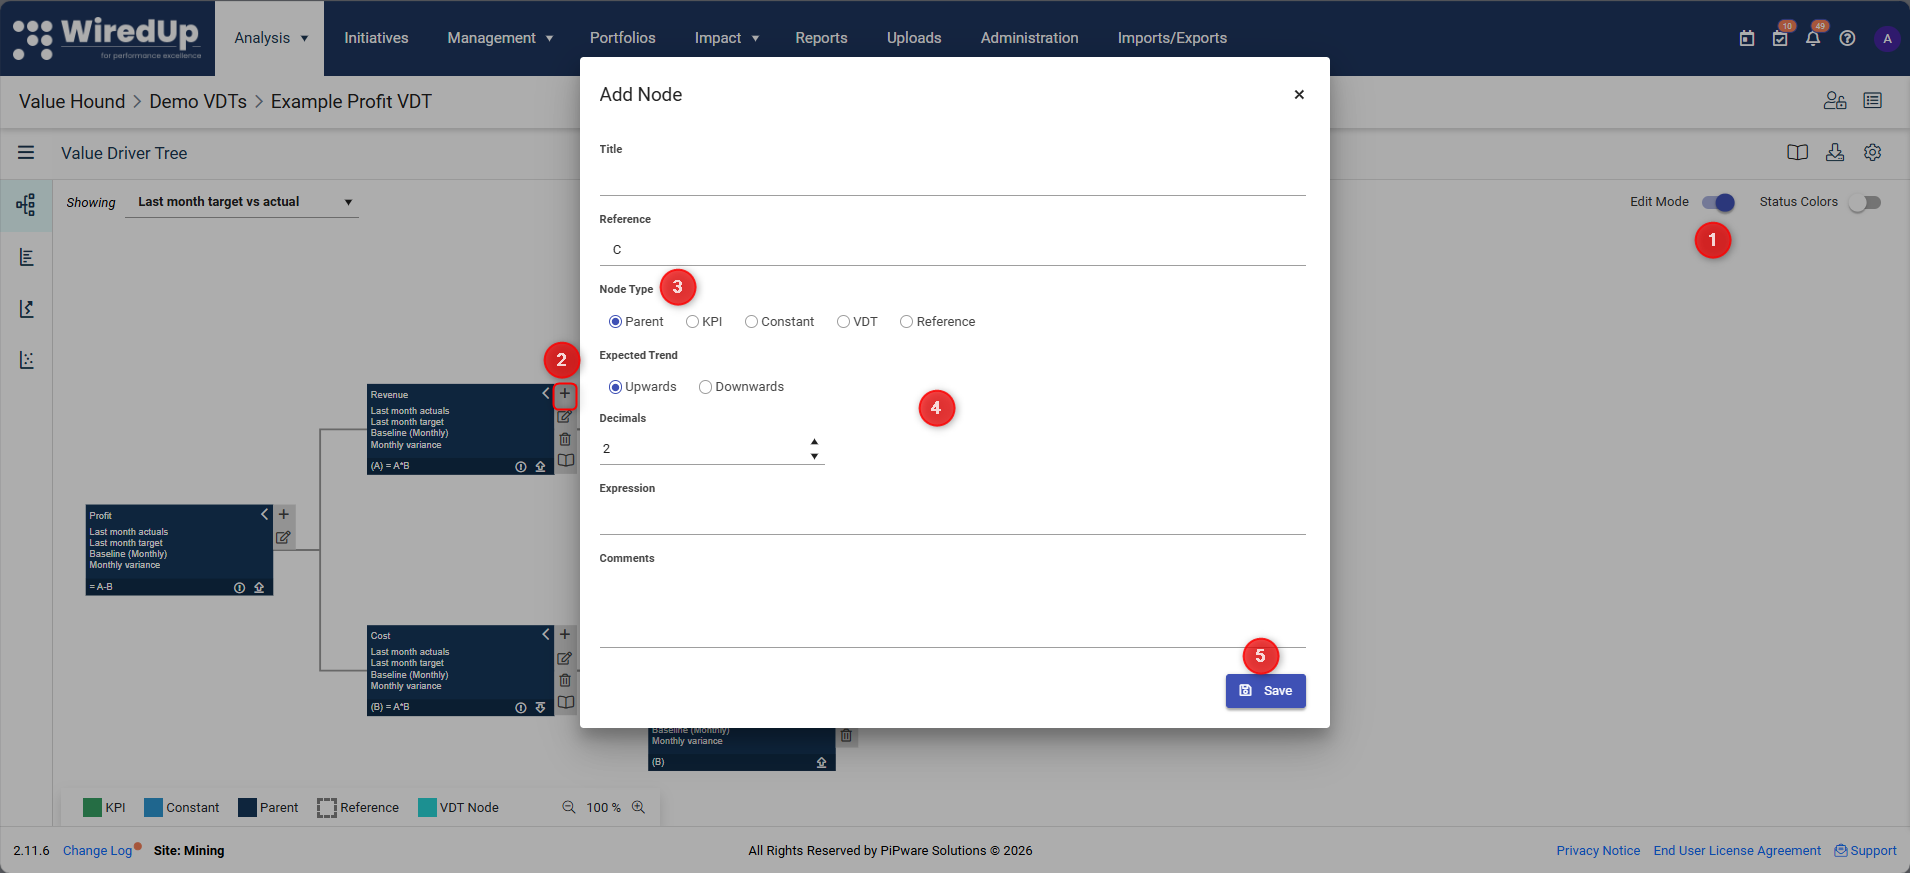
- Enable Edit Mode
- Select the + icon on the parent node
- Choose the appropriate node type
- Configure the node settings
- Click Save
The new node becomes part of the tree structure and can be used in calculations.
Node Types
Value Driver Trees support multiple node types, each serving a different purpose. Selecting the correct node type is important for maintaining a clear and maintainable model.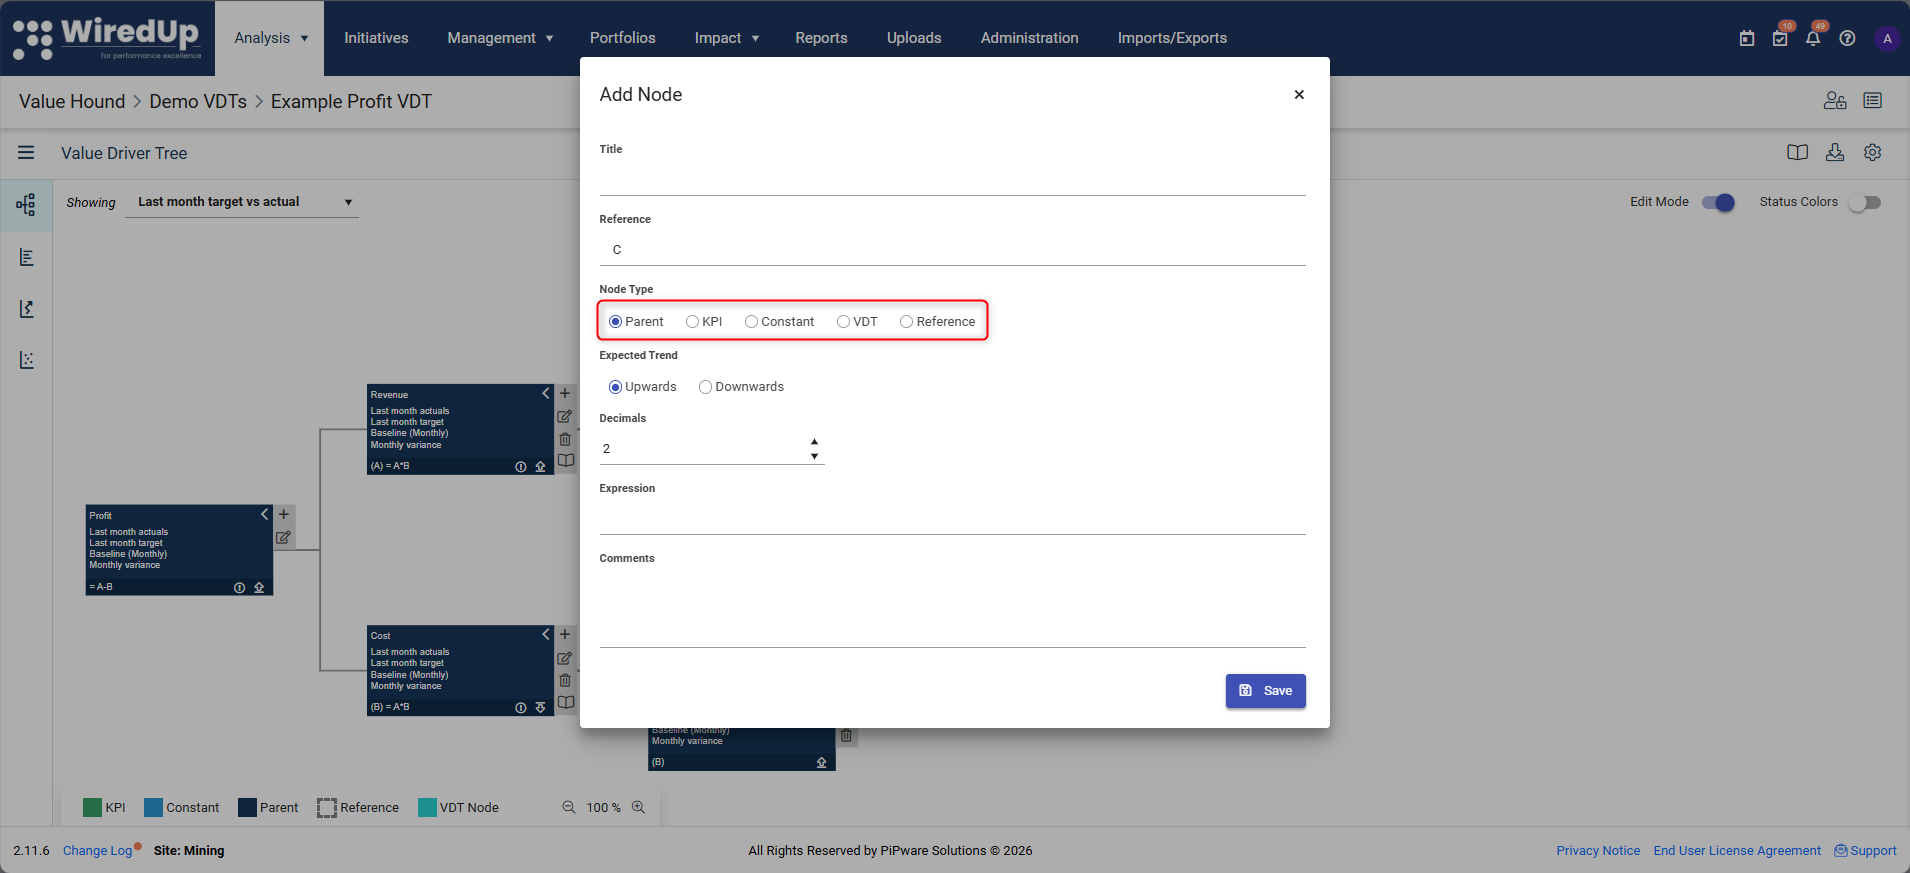
- Outcome Nodes
- Outcome nodes represent the top-level result or goal of the Value Driver Tree. They typically sit at the highest level and aggregate values from all contributing drivers below.
- Outcome nodes include a chart icon that allows you to visualize performance trends over time based on the currently selected View.
- Parent (Calculation) Nodes
- Parent nodes aggregate and calculate values from their child nodes using a defined formula. They do not contain original data and rely on child nodes for inputs.
- Parent nodes include a chart icon that allows you to visualize performance trends over time based on the currently selected View.
- KPI Nodes
- KPI nodes link a KPI into the Value Driver Tree. They provide numerical values (Actual, Target, Baseline) and typically sit at the lowest level of the tree. There are 3 types of KPIs you can add as a node:
- Manual KPIs: KPIs that have values manually added via manual input, import templates or API integration
- Initiative Output KPI: an automated portfolio-level metric that aggregates and sums benefit values from multiple linked Initiatives (for more information, see this article: Initiative Output KPI)
- Calculated KPI: KPIs that have values calculated from linked KPIs using formulas
- KPI nodes link a KPI into the Value Driver Tree. They provide numerical values (Actual, Target, Baseline) and typically sit at the lowest level of the tree. There are 3 types of KPIs you can add as a node:
- Constant Nodes
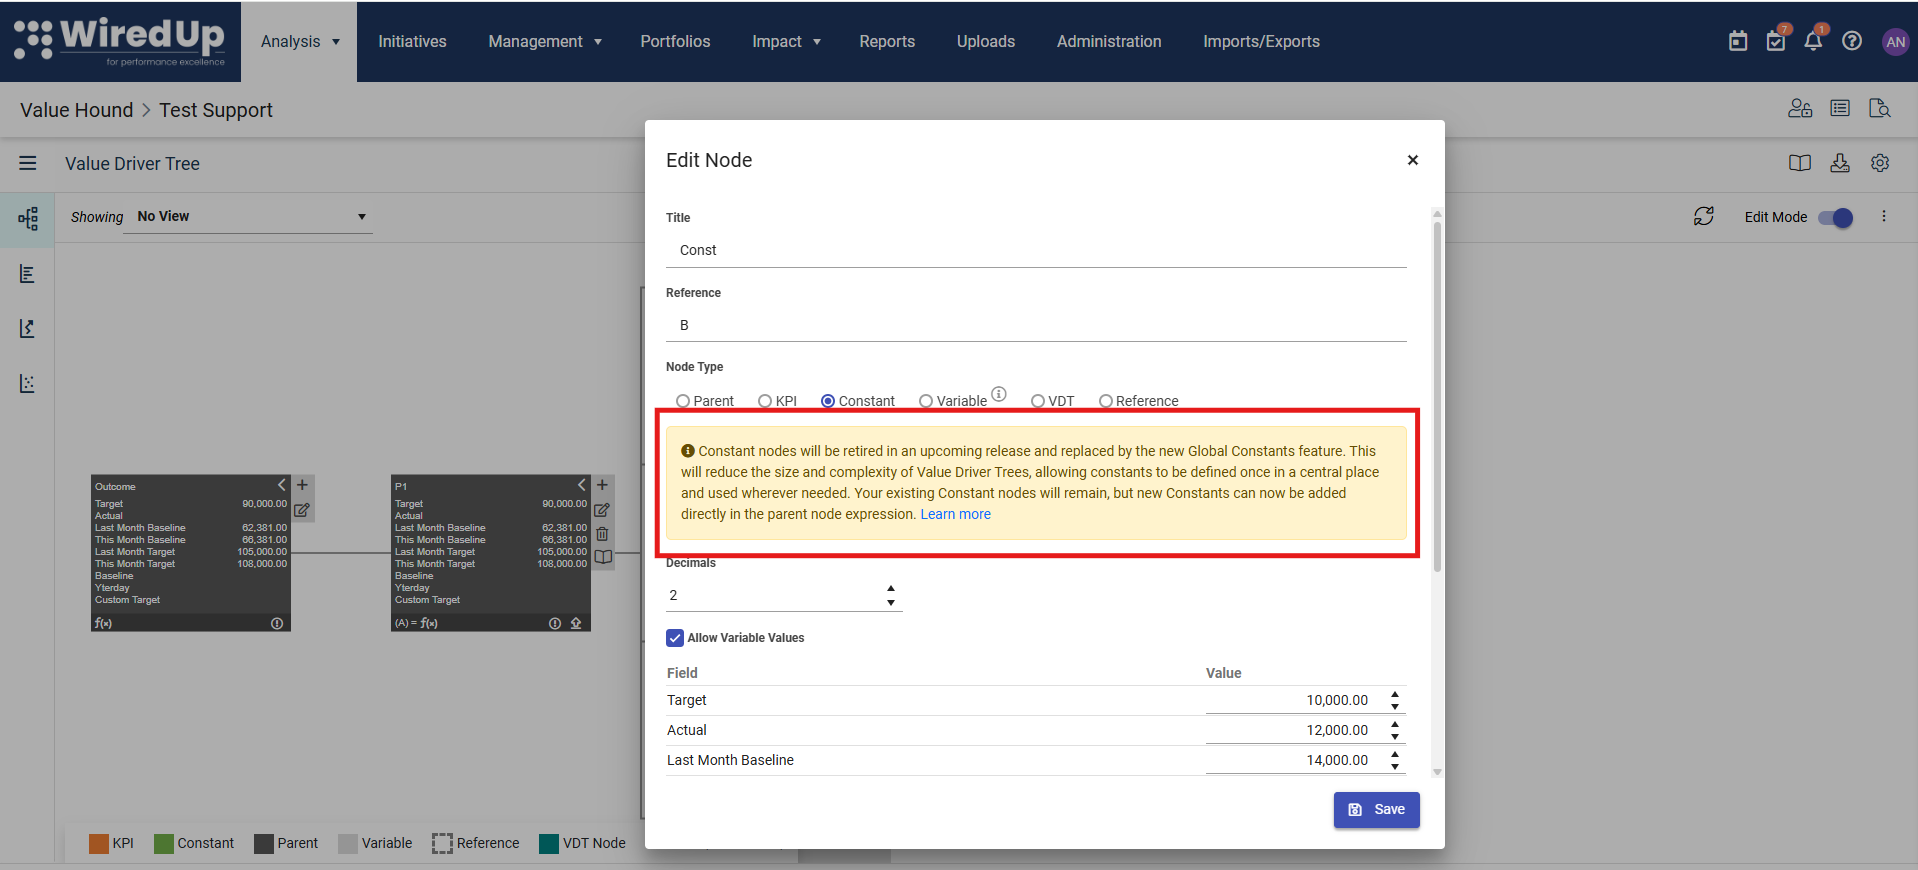
- Constant nodes hold fixed values that do not change over time. These are often used for assumptions or static inputs.
A notification is displayed on Constant nodes that constant nodes will be retired and replaced by global constants. For more information on global constants, please see this article: Managing Global Constants
- Reference Nodes
- Reference nodes reuse the value of another node within the same Value Driver Tree. They allow the same metric to be used in multiple calculations without duplication.
- Reference nodes include a chart icon that allows you to visualize performance trends over time based on the currently selected View.
- VDT Nodes
- VDT nodes represent imported Value Driver Tree structures. They allow entire subtrees to be reused within a larger model.
- VDT nodes (also called Link VDT nodes) include a chart icon that allows you to visualize performance trends over time based on the currently selected View.
- Variable node (NEW): this new node allows users to represent KPI metrics that are external or uncontrollable — such as commodity prices or ore grades — that contribute to VDT expressions but should not be included in analysis tools. For more information on how this node works, please see this article:
Each node type behaves differently and should be used intentionally to keep calculations transparent.Modify Hierarchy and Structure
You can change the hierarchy of a Value Driver Tree to better reflect business logic.
Common structural changes include:
- Moving nodes to a different parent
- Reordering drivers within the same level
- Adding or removing layers of detail
When restructuring:
- Ensure calculation expressions are updated to reflect new child nodes
- Validate results after changes to confirm calculations remain correct
Update Calculation Logic
Parent nodes use expressions to define how child node values are combined.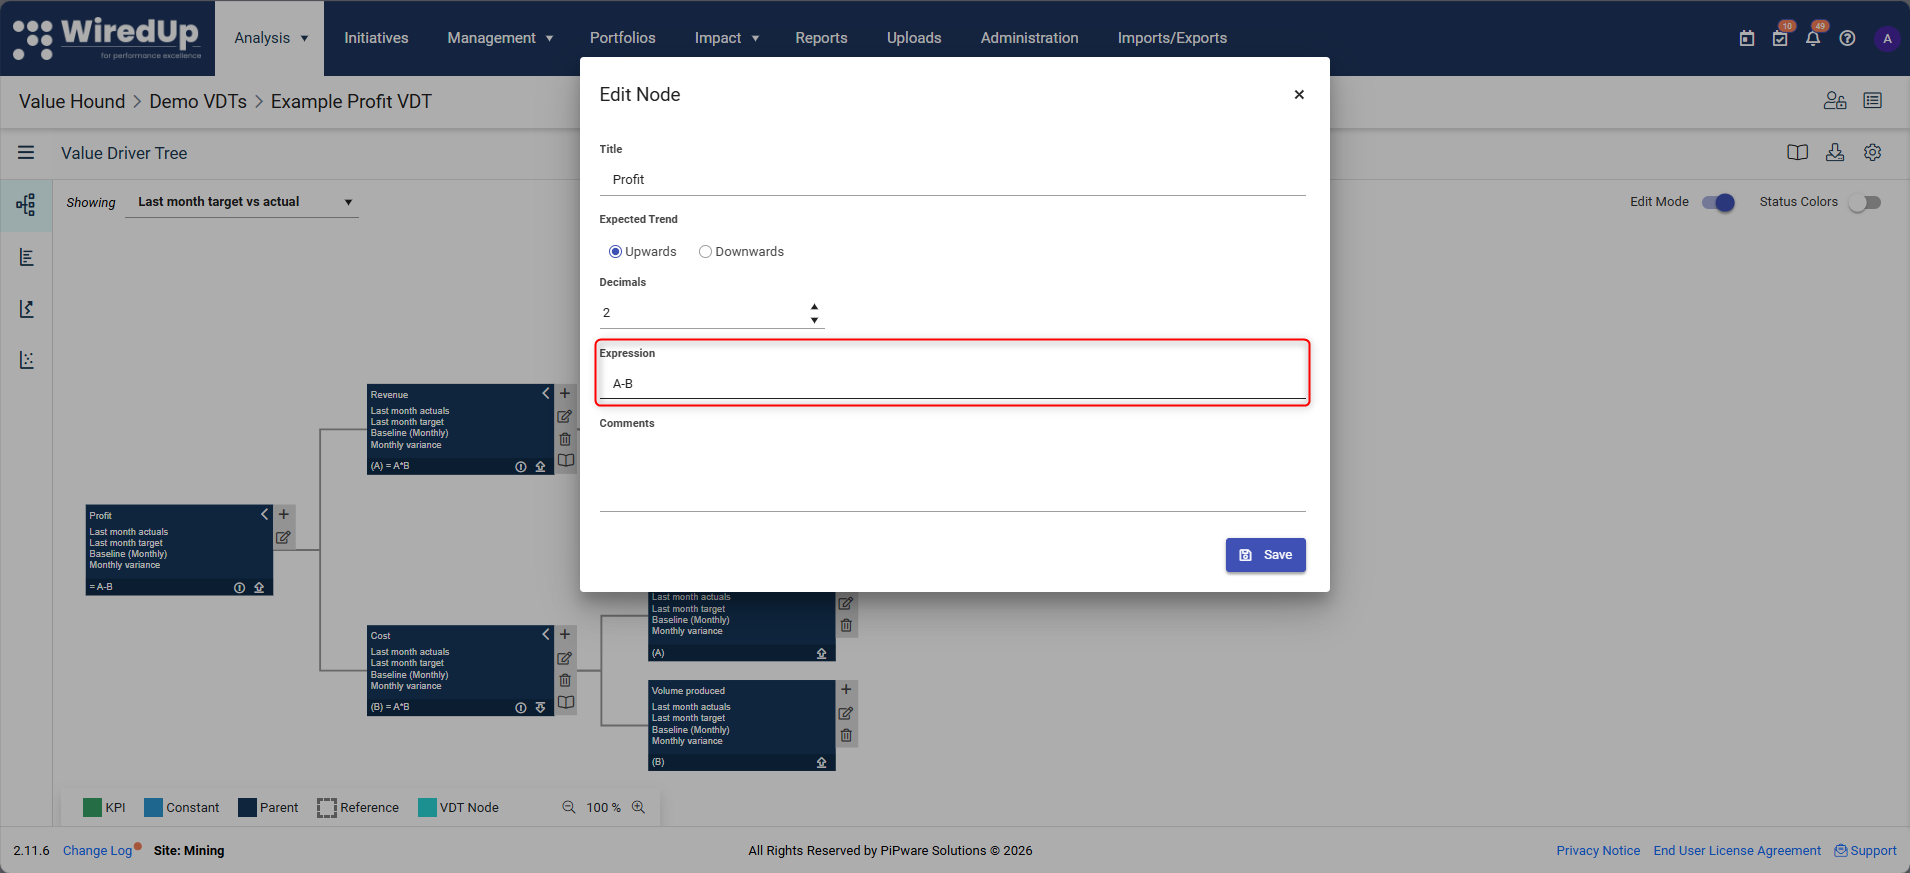
When updating calculation logic:
- Use node references (A, B, C, etc.) consistently
- Ensure each referenced node exists and is correctly ordered
- Test changes by reviewing calculated results at higher levels
Calculation changes affect all downstream results and should be reviewed carefully.
Downloading the VDT
The VDT can be exported in multiple formats to support different use cases. Click on the download icon in the toolbar to access the download options:
Available Download Options:
- Download Excel (Visual)
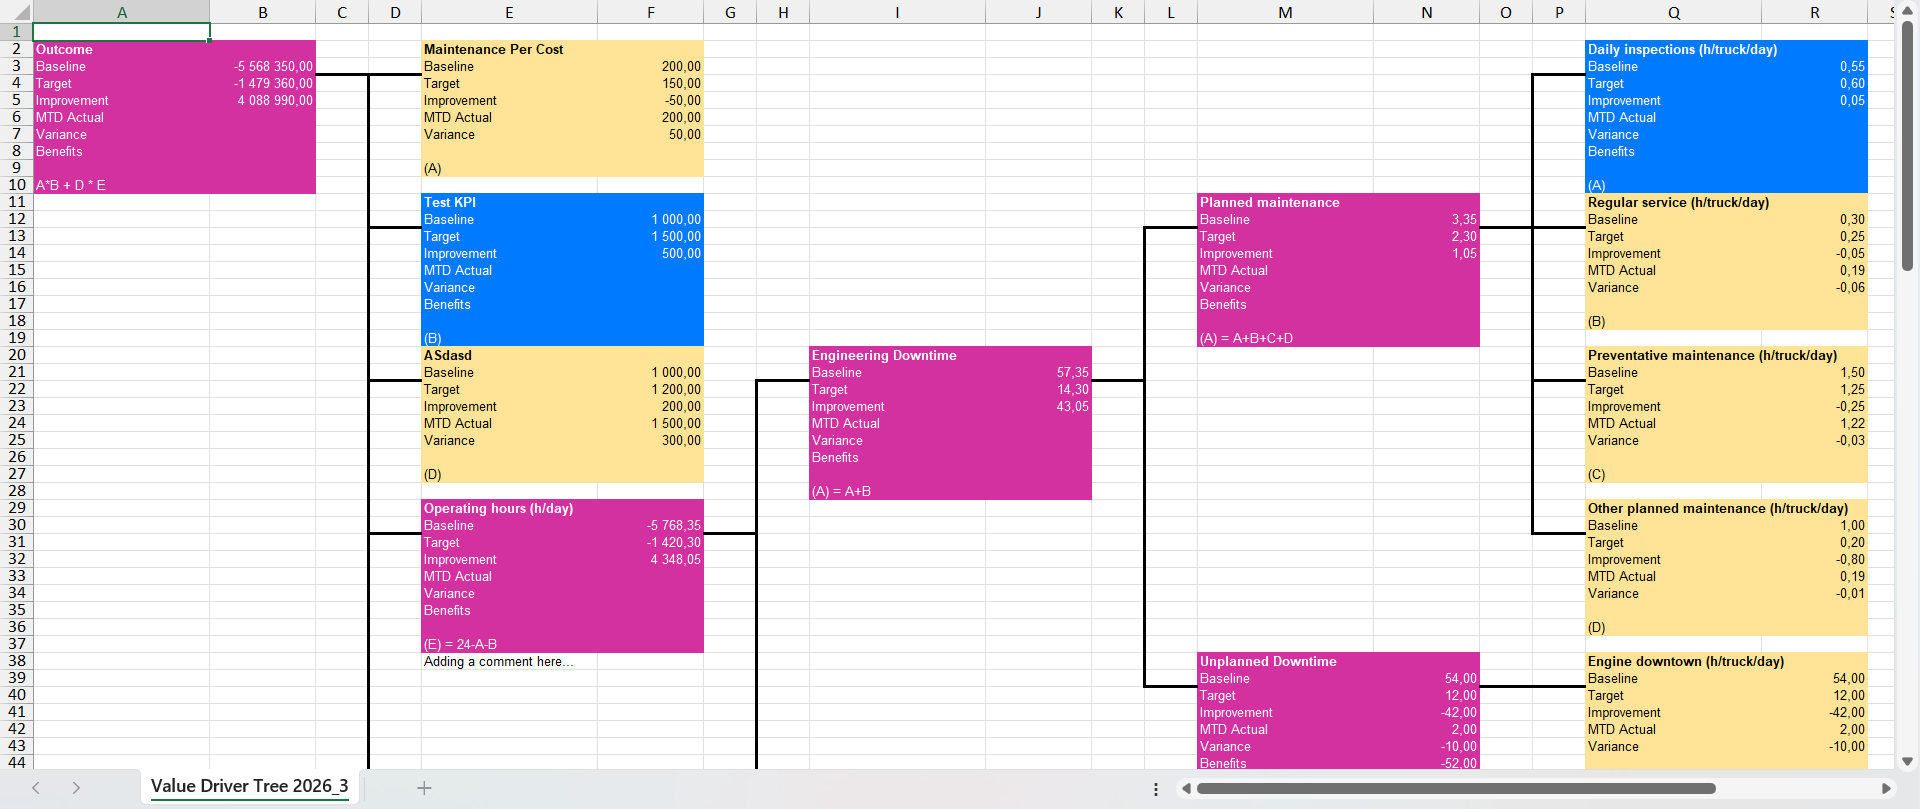
- Exports the VDT in a visual Excel format that mirrors the tree structure displayed in the UI
- Useful for presentations, reports, and visual analysis
- Preserves the hierarchical layout and formatting of the VDT
- Download Excel (Import Template)
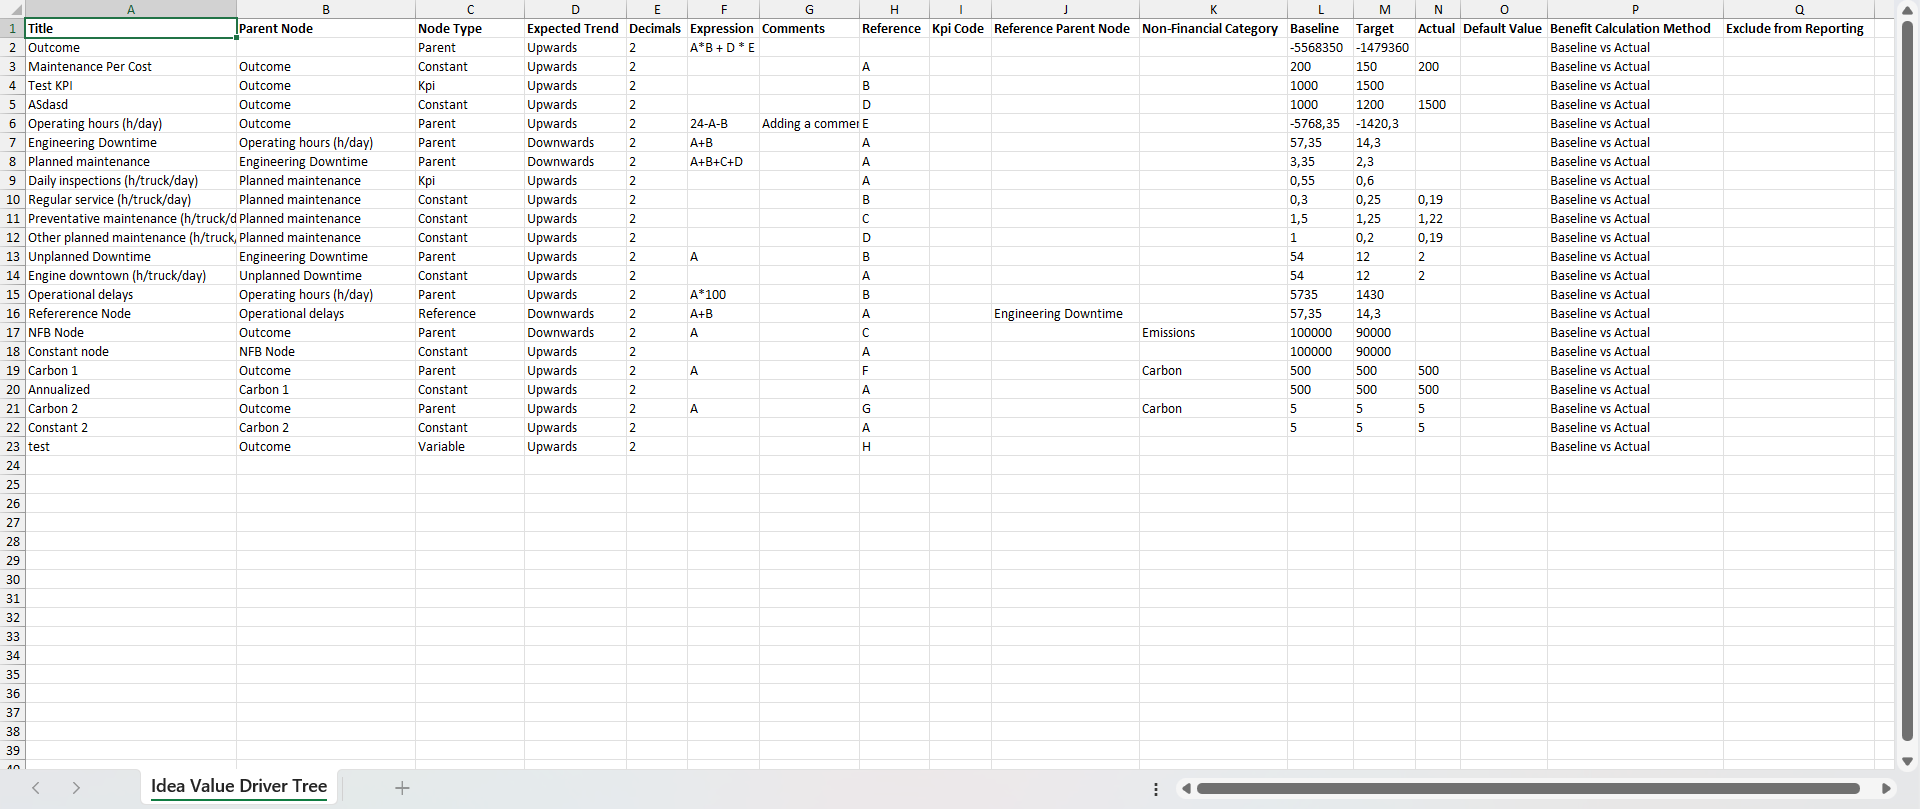
- Exports the VDT in the same structure and column layout as the VDT import template
- Enables round-trip workflows where you can export, modify, and re-import the VDT
- Matches the VDT import template structure with proper column layout and hierarchy representation
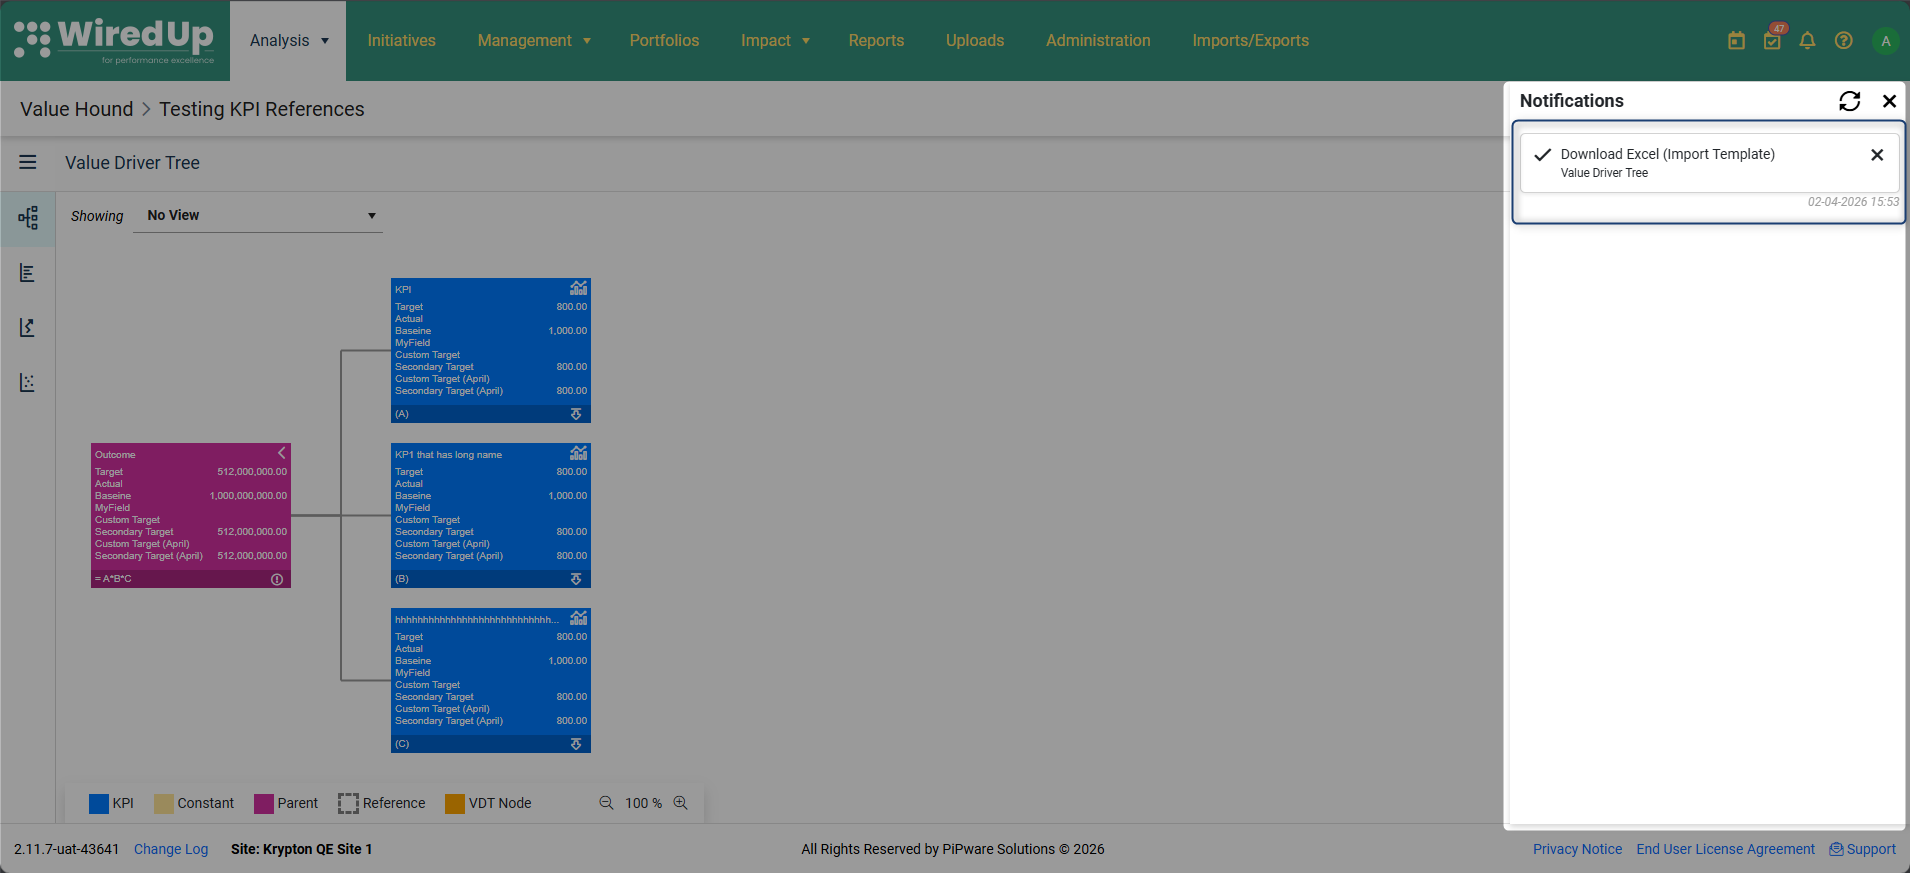
- When selected, the file will be processed and once complete, you can download the template from the notifications panel
How to Download:
- Click the download icon in the VDT toolbar
- Select your preferred download format from the dropdown menu:
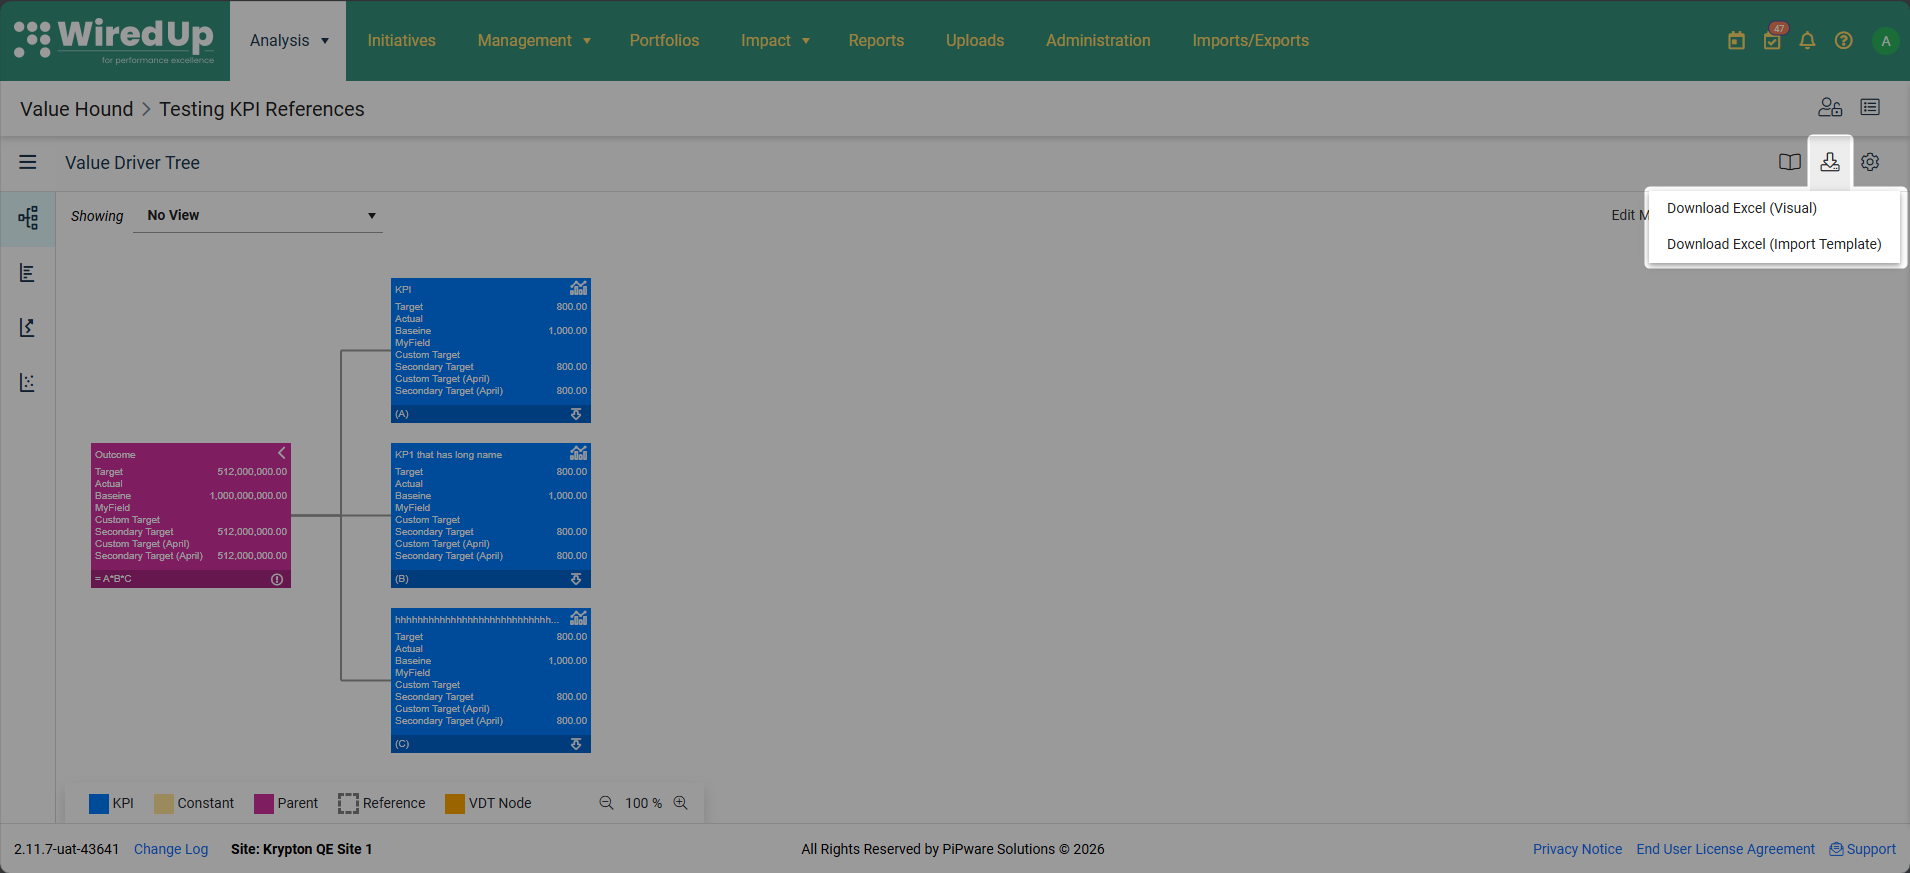
- Download Excel (Visual) for visual representation
- Download Excel (Import Template) for template-based export
- For Excel (Import Template) downloads, wait for the file to be processed
- Once processing is complete, navigate to the notifications panel to download your file
- For Excel (Visual) and PDF downloads, the file will download immediately
Use Cases:
- Excel (Visual): Best for presentations, stakeholder reports, and visual analysis
- Excel (Import Template): Best for making bulk changes to the VDT structure and re-importing
Best Practices
- Keep calculation logic in the Value Driver Tree where possible, rather than in KPIs
- Use clear, descriptive node names
- Limit the use of reference nodes to avoid hidden dependencies
- Validate calculations after structural changes
- Avoid unnecessary complexity in deeply nested trees
- Use the performance chart to validate node calculations and spot trends — the chart provides a quick visual check that values are calculating as expected over time
What Happens Next
At this stage, you can:
- Continue refining the Value Driver Tree structure
- Reuse or extend existing models
- Store updated Value Driver Trees in the library for reuse
In the next article, we will cover how to import KPIs and data into a Value Driver Tree.
Next Steps
To learn how to import KPIs and data into your Value Driver Tree, see:
- Importing KPIs and Data into a Value Driver Tree