In This Article
- Step 1: Open Value Hound
- Step 2: Create a New Value Driver Tree
- Step 3: Edit VDT Nodes
- Step 4: Add Calculation VDT Nodes
- Step 5: Continue Building Out the VDT
Overview
After creating a Value Driver Tree definition, you can create a Value Driver Tree (VDT) to model how business drivers combine to produce an outcome. A Value Driver Tree represents a mathematical model where nodes are linked together through formulas to explain performance, variance, and impact.
What is a Value Driver Tree?
A Value Driver Tree is a structured hierarchy of KPIs where:
- The output node (left hand side) represents the outcome you care about (for example, Profit, Cost, Throughput)
- The nodes to the right of it are the drivers of that outcome, linked using formulas so values roll up through the tree
Example:
In a typical profit model, Profit is the output node and is calculated using A − B, where A = Revenue and B = Cost. Revenue and Cost are then broken into their own drivers (for example, Revenue = Selling Price × Sales Volume and Cost = Unit Cost × Volume).
The view shown at the top (for example, "Last month target vs actual") and the fields displayed on each node (such as Last month actuals, Last month target, Baseline (Monthly), and Monthly variance) come from your Value Driver Tree definition.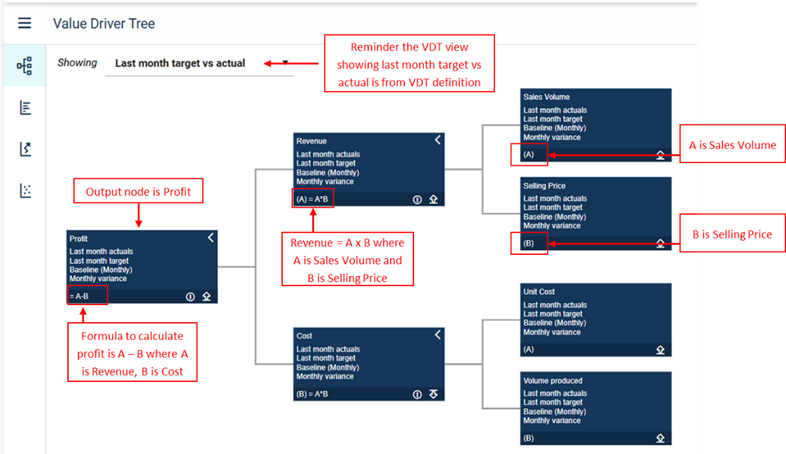
Create a Value Driver Tree
Step 1: Open Value Hound
Navigate to Analysis > Value Hound
Step 2: Create a New Value Driver Tree
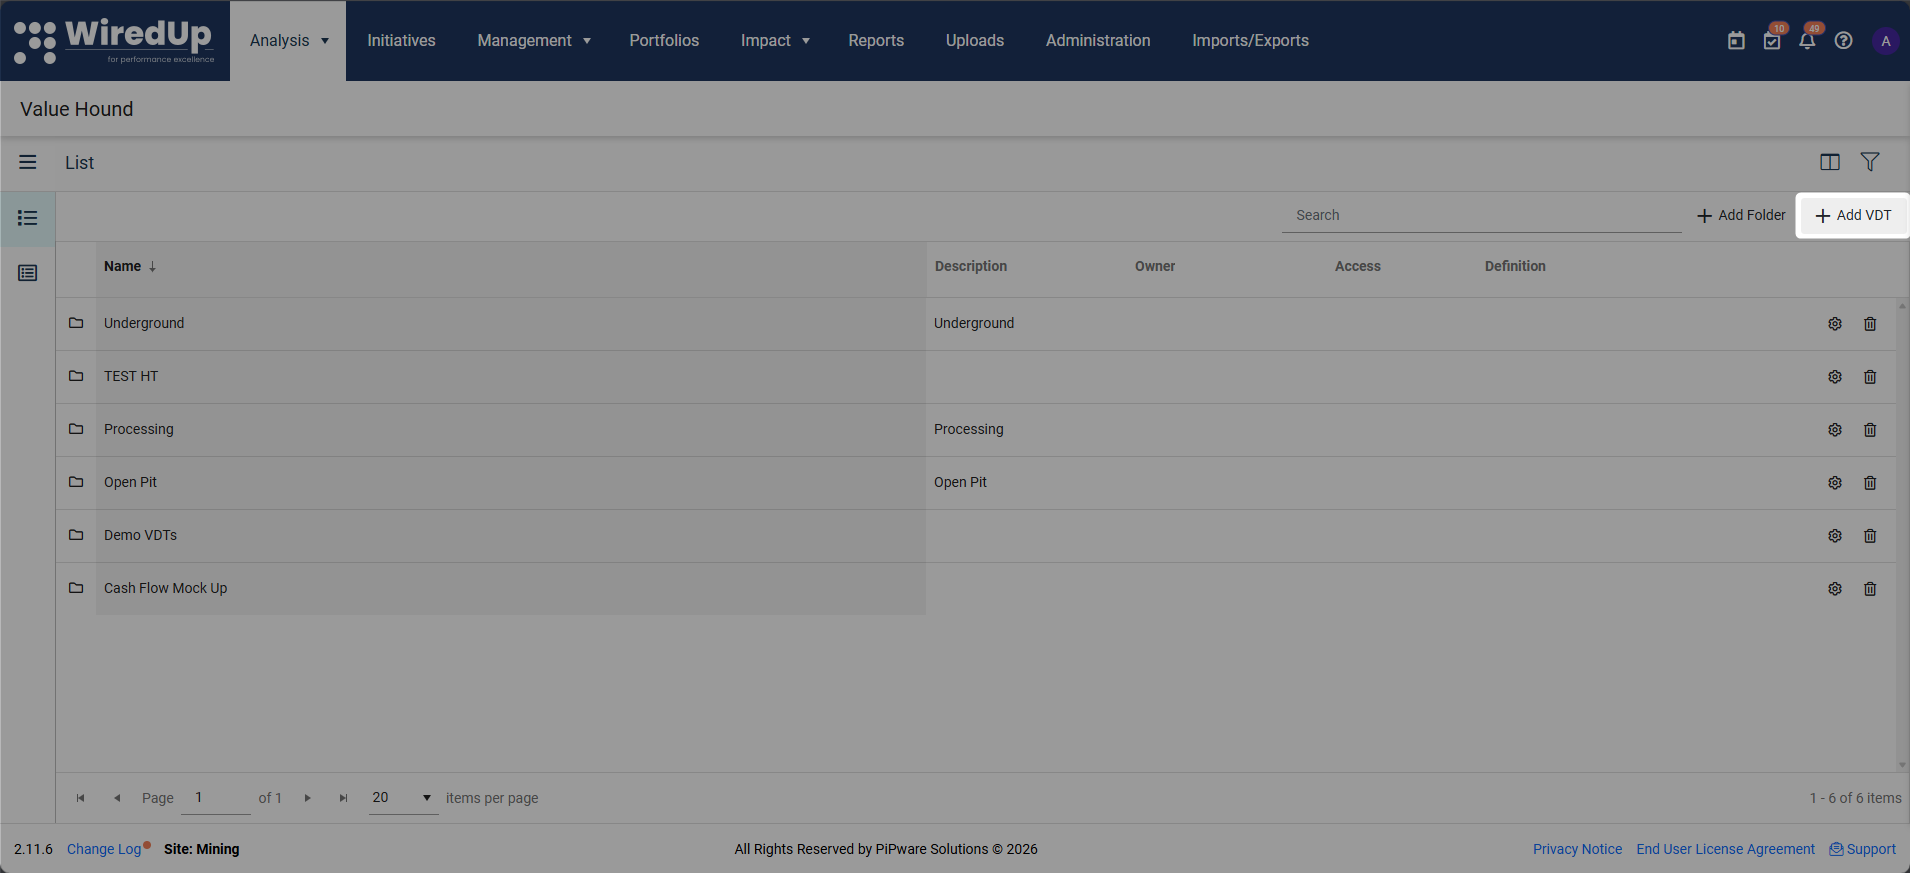
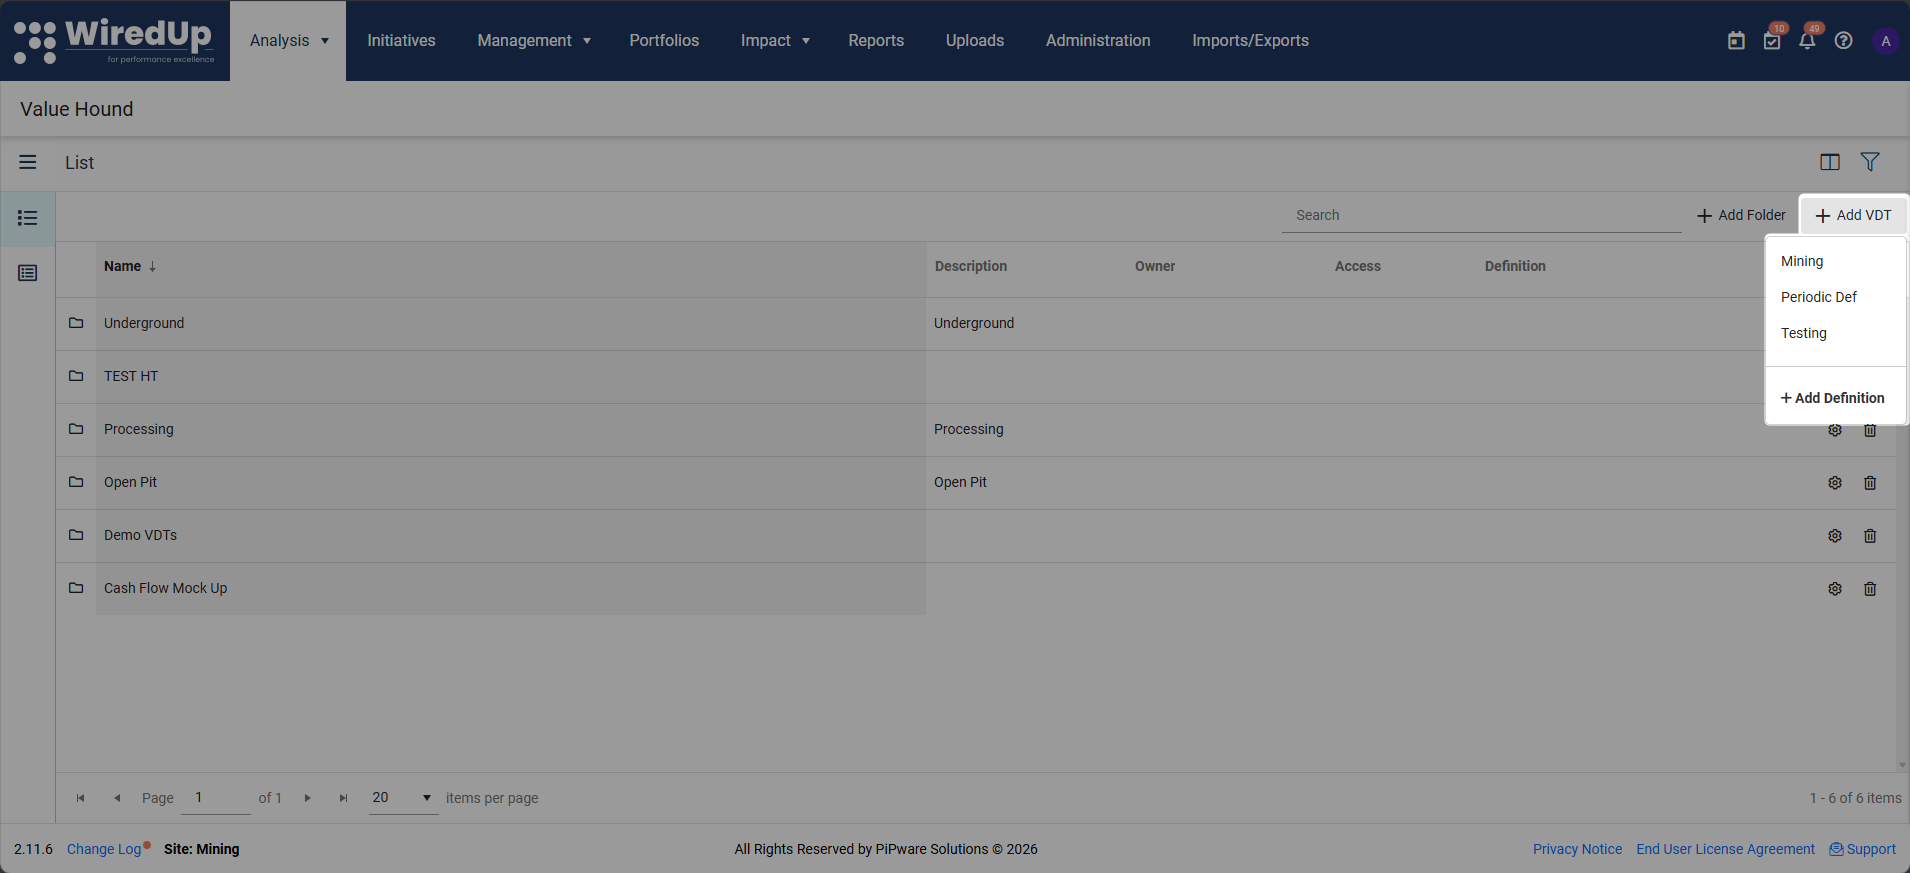
- Select + Add VDT located on the top right hand corner of the screen.
- Choose an existing Value Driver Tree definition. To create a definition, see Create a Value Driver Tree Definition article
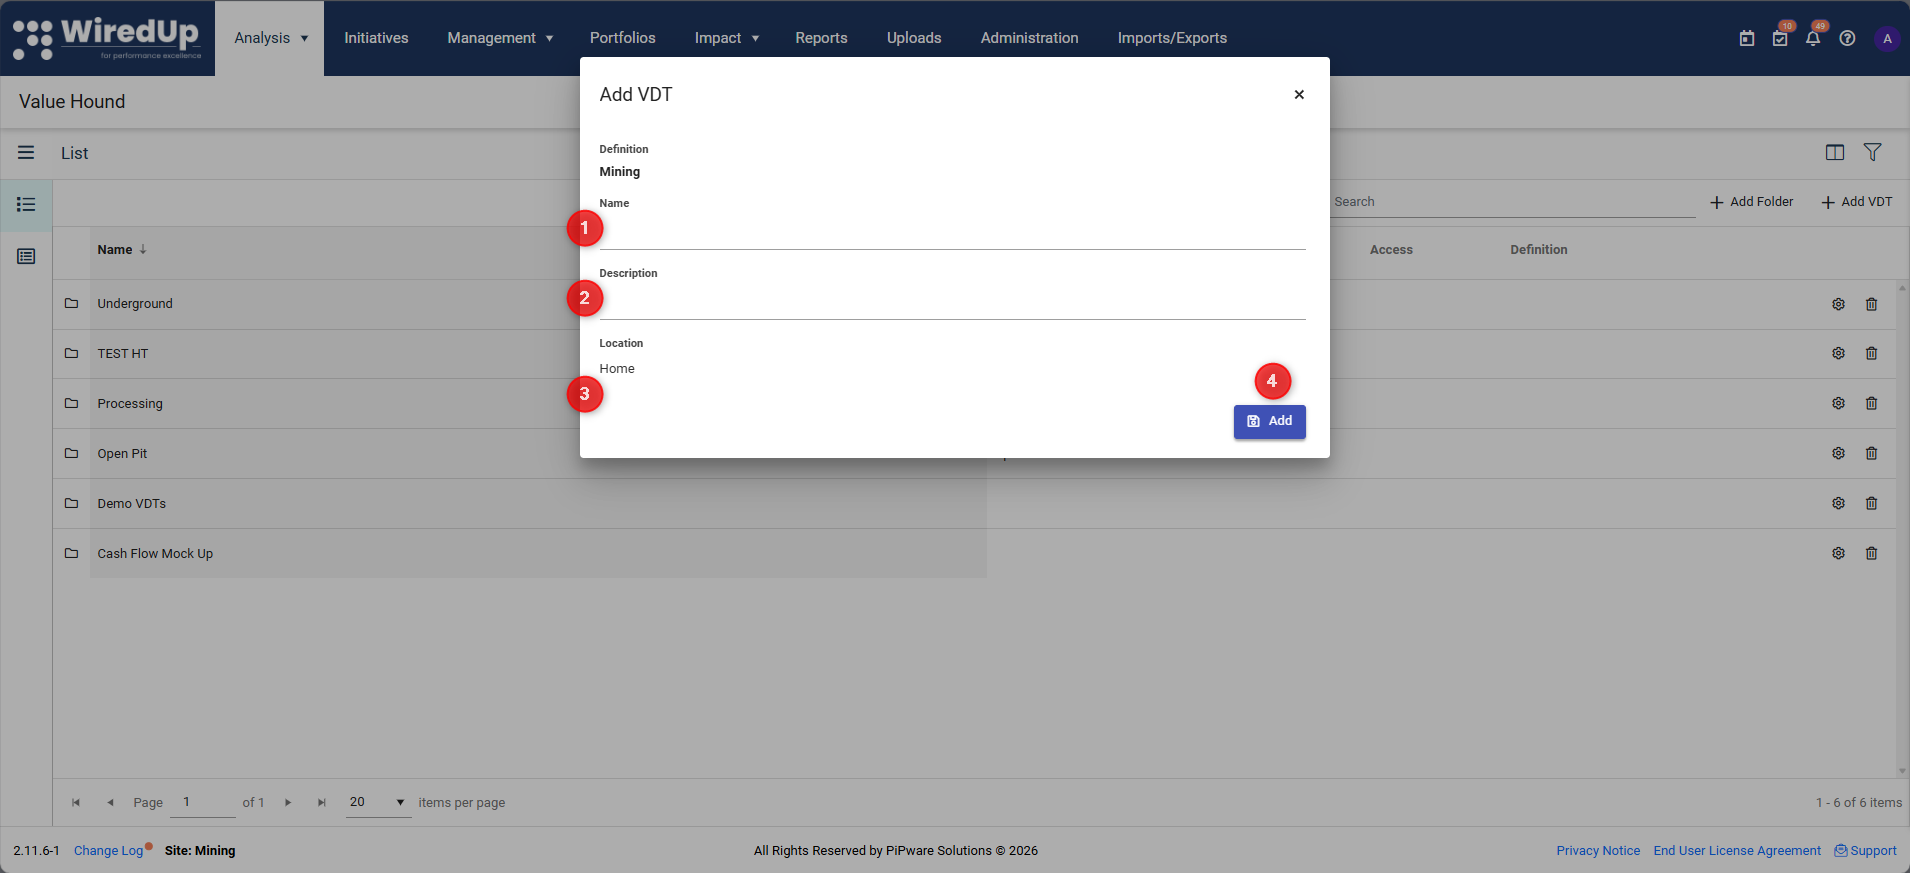
- Enter a name, description (optional) and location folder for the Value Driver Tree. Once complete, click Add to add a new VDT
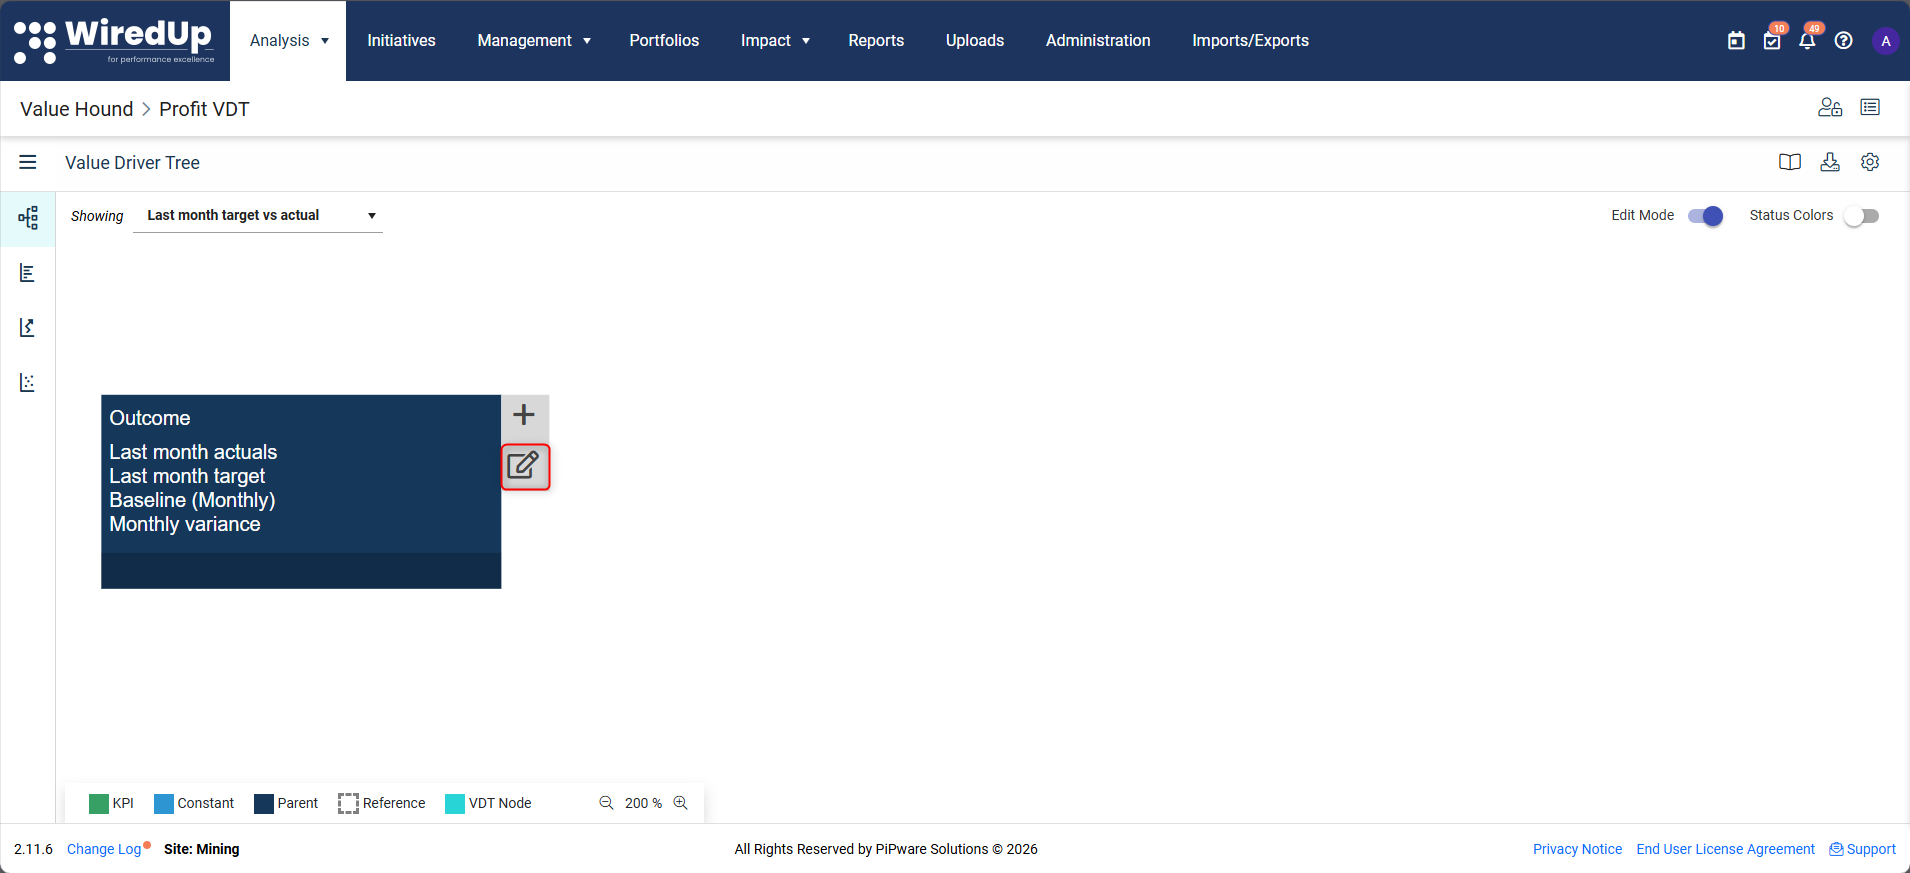
- Below is what the blank VDT will look like when created.

Step 3: Edit VDT Nodes
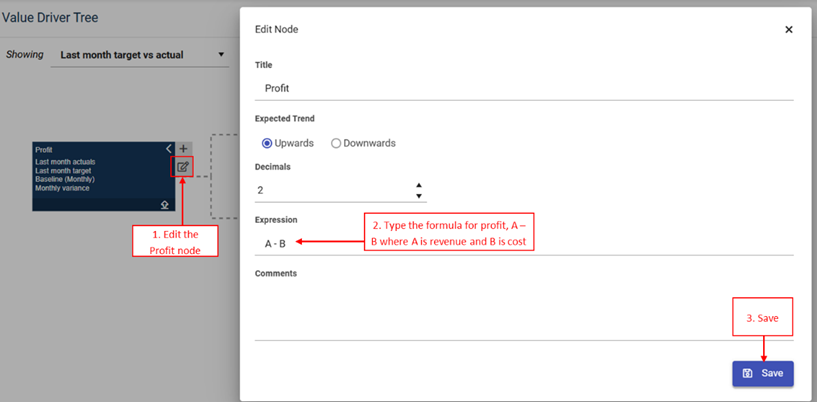
Ensure your VDT is on edit mode to allow you to rename and add VDTs.- Select the edit icon on the Outcome node.
- You'll be prompted with the following fields when configuring the node:
- Name: The label displayed on the node. This should clearly describe what the KPI represents
- Expected Trend: Indicates whether higher or lower values represent better performance. This is used for status colouring and visual indicators
- Decimals: Controls the number of decimal places displayed on the node. Reducing decimals can improve readability when values are long or highly precise
- Expression: Defines how the node is calculated from its child nodes using a formula. This is typically configured after driver nodes are added
- Comments: Optional notes to describe assumptions, logic, or context for the node
For example, creating a VDT that shows profit:
Configure the outcome node with the name "Profit" and set the appropriate expected trend and decimals.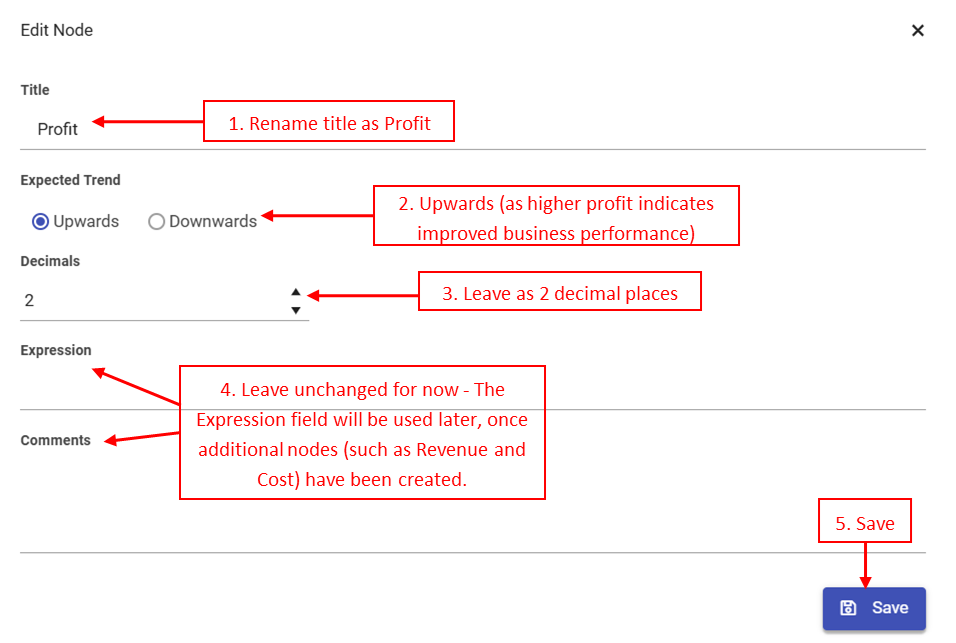
Step 4: Add Calculation VDT Nodes
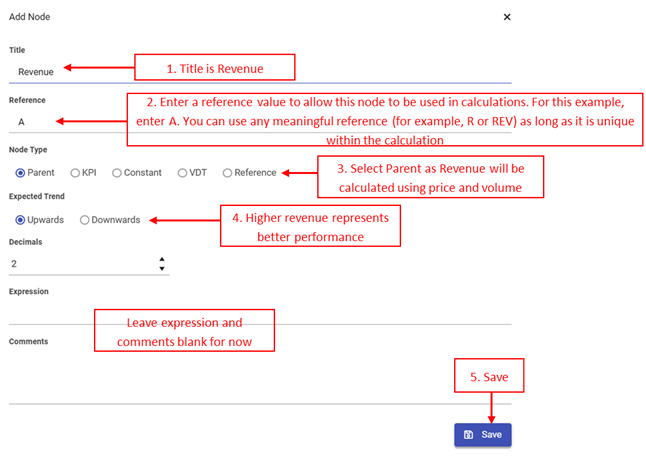
After configuring the Outcome node, add the supporting nodes used to calculate the outcome node.
In the above example, Profit is calculated as Revenue minus Cost, so we need nodes for Revenue and Cost.
- Select the + icon on the Profit/Outcome node

- Add a parent node for Revenue
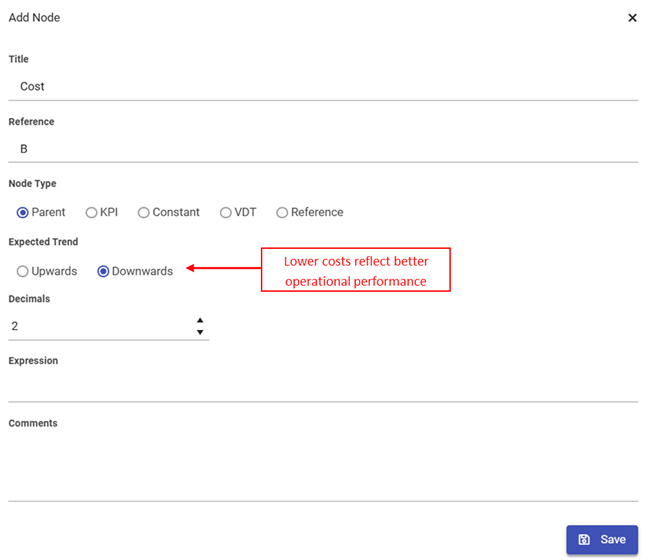
- Select the + icon on the Profit node again and add a parent node for Cost
- At this stage, you will see dashed lines between the nodes. This indicates that the nodes are structurally connected but not yet mathematically linked. The calculation must be defined.
- Select edit on the profit VDT box, type expression as A – B. This makes the VDT mathematical logic work.
Step 5: Continue Building Out the VDT
Most Value Driver Trees include more than two layers. To add more detail and insight:
Repeat the same process to add additional driver nodes.
For example:
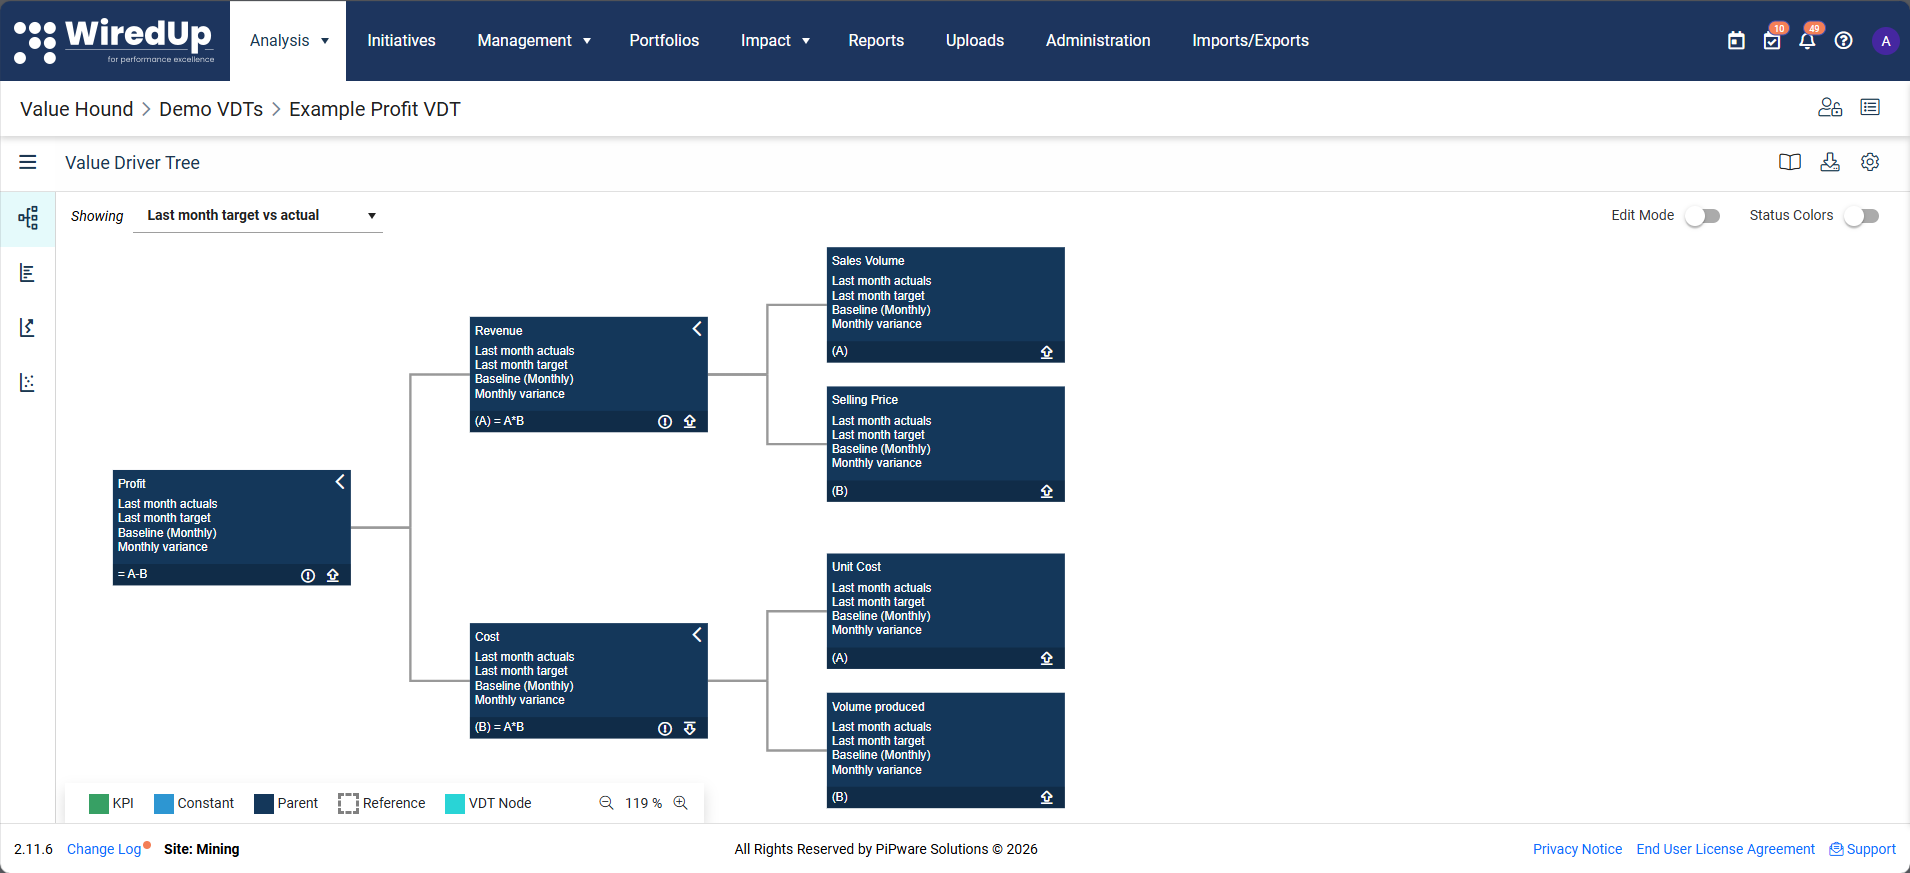
- Break Revenue into Selling Price multiplied by Sales Volume
- Break Cost into Unit Cost multiplied by Volume Produced
At this stage, you have built the structure and calculation logic of your Value Driver Tree.
Your VDT now:
- Has an output node (Profit)
- Includes supporting driver nodes (Revenue and Cost)
- Uses formulas to define how values roll up through the tree
However, you may notice that no numerical values are displayed yet. This is expected. In a later article, we will show you how to add data to populate the Value Driver Tree.
Next Steps
To learn how to add KPIs and values to your Value Driver Tree, see: